Introduction
The Reserve Bank of India (RBI) has a history of adjusting the repo rate in response to economic conditions, particularly during downturns. The repo rate, which is the rate at which the RBI lends money to commercial banks, serves as a primary tool for controlling inflation and stimulating economic growth. Understanding historical trends and their impacts can provide insights into the effectiveness of such monetary policies.
Historical Repo Rate Adjustments During Economic Downturns
The RBI has implemented repo rate cuts to mitigate economic slowdowns on several occasions:
- 2008 Global Financial Crisis: The RBI reduced the repo rate from 9% in October 2008 to 4.75% by April 2009 to encourage lending and investment.
- 2012 Economic Slowdown: Facing decelerating growth, the RBI cut the repo rate from 8.5% in April 2012 to 7.25% by May 2013.
- COVID-19 Pandemic (2020): To counteract the economic impact of the pandemic, the RBI reduced the repo rate from 5.15% in October 2019 to 4% by May 2020.
These reductions were aimed at boosting liquidity in the market, supporting businesses, and facilitating economic recovery.
Repo Rate Trajectory Over the Last Five Years
Over the past five years, the repo rate has experienced several adjustments:
- 2019: The rate was reduced from 6.5% to 5.15% to address slowing economic growth.
- 2020: In response to the pandemic, the rate was further cut to 4%.
- 2022: As the economy showed signs of recovery, the RBI increased the rate to 5.9% by September 2022.
- 2023-2024: Rates remained stable to control inflation amid global economic uncertainties.
- 2025: On February 7, 2025, the RBI cut the repo rate by 25 basis points to 6.25% to support economic growth amid a downturn.
Impact of Past Rate Cuts on Inflation, GDP Growth, and Stock Markets
Historically, repo rate cuts have had mixed effects:
- Inflation: Rate cuts can lead to increased money supply, potentially causing higher inflation if not matched by output growth. For example, inflation surged post-2009 but remained controlled post-2020 due to policy interventions.
- GDP Growth: Lower rates generally stimulate borrowing and investment, contributing to economic expansion. India’s GDP saw a rebound in 2010 and 2021 after significant rate cuts.
- Stock Markets: Equity markets often respond positively to rate cuts due to expectations of enhanced corporate profitability from reduced borrowing costs. The Sensex and Nifty surged post-COVID rate cuts.
However, the effectiveness of rate cuts depends on factors such as the transmission of rate changes to end consumers, prevailing economic conditions, and global economic trends.
Visualizing the Trends
To provide a clearer picture, here are some charts illustrating the repo rate changes, GDP growth rates, and inflation trends over the past years:
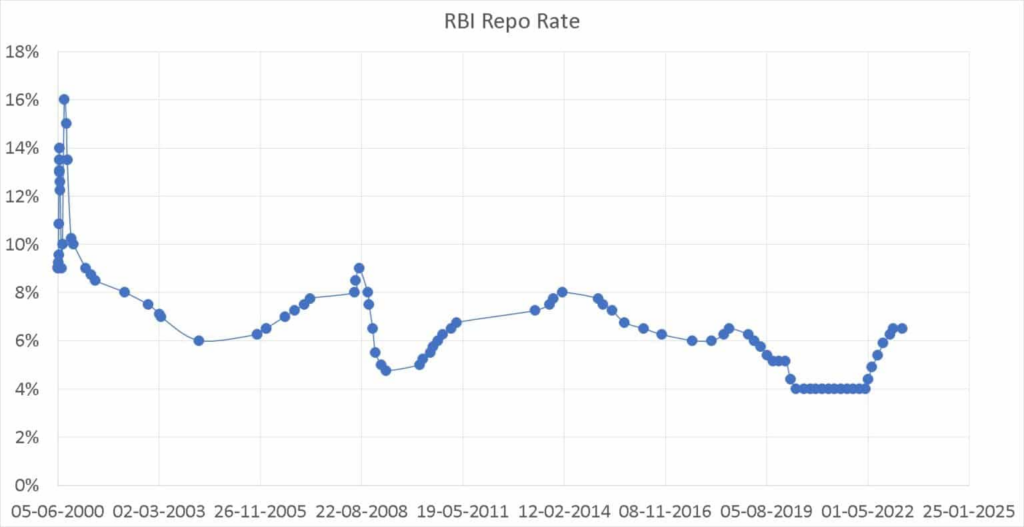
Repo Rate History (2005-2025)
(Data Source: FreeFincat)
GDP Growth Rates (2005-2025)
(Data Source: World Bank)
Inflation Trends (2005-2025)
(Data Source: World Bank)
Conclusion
The RBI’s repo rate adjustments play a crucial role in shaping India’s economic landscape. While rate cuts stimulate growth, they also carry risks such as inflation. Understanding historical trends helps policymakers and investors make informed decisions. With the latest rate cut in 2025, its impact on economic recovery and inflation will be closely watched in the coming months.