
Delhi-NCR is preparing for a fresh scientific assessment of its air pollution, nearly a decade after earlier studies attempted to identify the biggest contributors to the region’s poor air quality. The new exercise aims to establish whether cleaner fuels, newer vehicles, changing industrial activity and other developments have altered the pollution mix residents breathe.
The question is important because air pollution is not a single substance. The air over Delhi and neighbouring cities can contain fine particles emitted directly by vehicles, industries and burning waste, as well as particles that form later when gases react in the atmosphere. Dust, regional pollution transport and seasonal crop-residue burning can also contribute.
A new emissions inventory, alongside a recently inaugurated air-analysis laboratory, is expected to give researchers a more detailed picture of these sources. But there is a distinction worth making at the outset: the new decade-on-decade assessment is still underway. Its results are not yet available, so it is too early to conclude that Delhi’s pollution has become more toxic, less toxic or fundamentally different from what residents breathed ten years ago.
The planned assessment will examine emissions across Delhi and the wider National Capital Region using a much finer geographical grid than broad city- or region-level estimates can provide.
The project involves the Automotive Research Association of India (ARAI), The Energy and Resources Institute (TERI), IIT Delhi and the Indian Institute of Tropical Meteorology (IITM). It is funded by the Central Pollution Control Board, with support from the Commission for Air Quality Management (CAQM). The inventory is designed to represent current emissions more precisely and help improve air-quality analysis and planning.
Finer geographical mapping
A 500-metre grid is intended to make the emissions inventory more location-specific across NCR.
A wider range of pollutants
The work covers particulate matter and gases such as nitrogen oxides, sulphur dioxide, carbon monoxide, ammonia and volatile organic compounds.
A current baseline and future scenarios
The project is intended to update the evidence base and assess possible emissions patterns in 2030, 2035 and 2040.
The aim is not simply to produce another list of pollution sources. A finer inventory can help identify where emissions originate, how their relative importance varies across the region and which interventions may have the greatest effect.
The results are expected to support better air-quality forecasting and more targeted action. However, an emissions inventory estimates what is released into the air; it is not, by itself, a direct measurement of what every neighbourhood is breathing at a particular moment.
The Air Quality Index, or AQI, gives residents a useful indication of how polluted the air is. It does not, on its own, reveal the full chemical composition of that pollution or identify every source responsible for it.
Two important measures are PM2.5 and PM10. PM2.5 refers to fine particles with a diameter of 2.5 micrometres or less. PM10 includes particles up to 10 micrometres in diameter. Fine particles are particularly important to public health because they can penetrate deep into the respiratory system.
But the particles measured by air-quality monitors do not all originate in the same way.
This distinction matters because pollution does not stop forming when emissions leave a vehicle exhaust or industrial chimney. Chemical reactions can create additional particulate matter as pollutants mix and age in the atmosphere. That makes source identification more complicated than simply counting vehicles or measuring dust.
On October 24, 2026, IITM’s Integrated Atmospheric Chemistry and Aerosol Toxicity Analysis Laboratory, known as AATAL, was inaugurated in New Delhi. The facility is designed to analyse the composition of air pollution, investigate how pollutants transform in the atmosphere and help identify their likely sources.
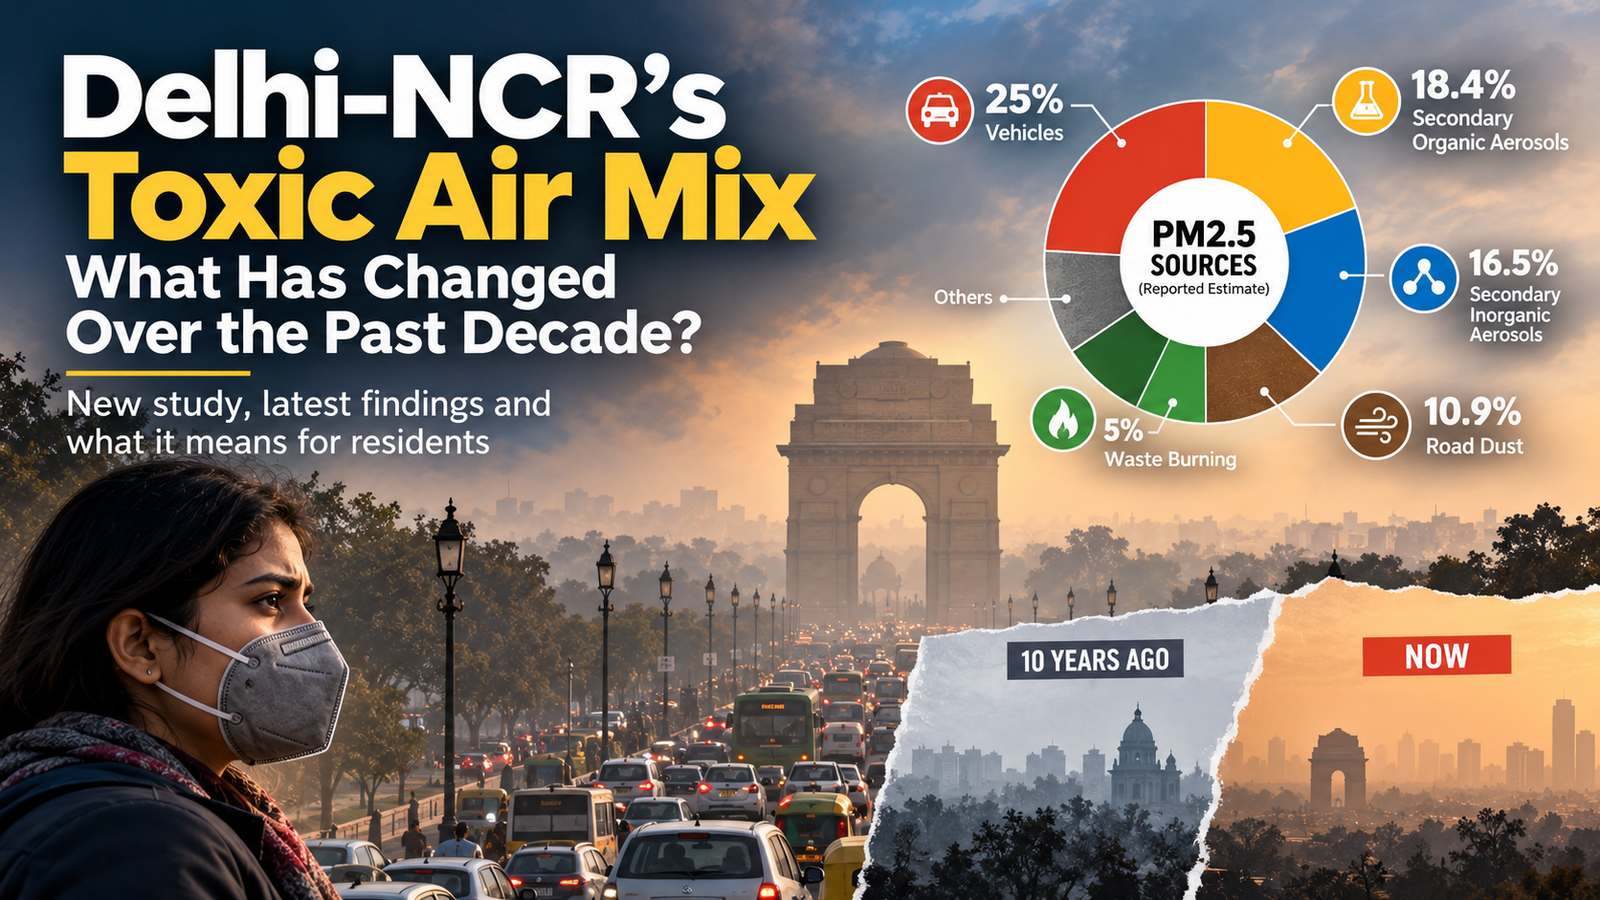
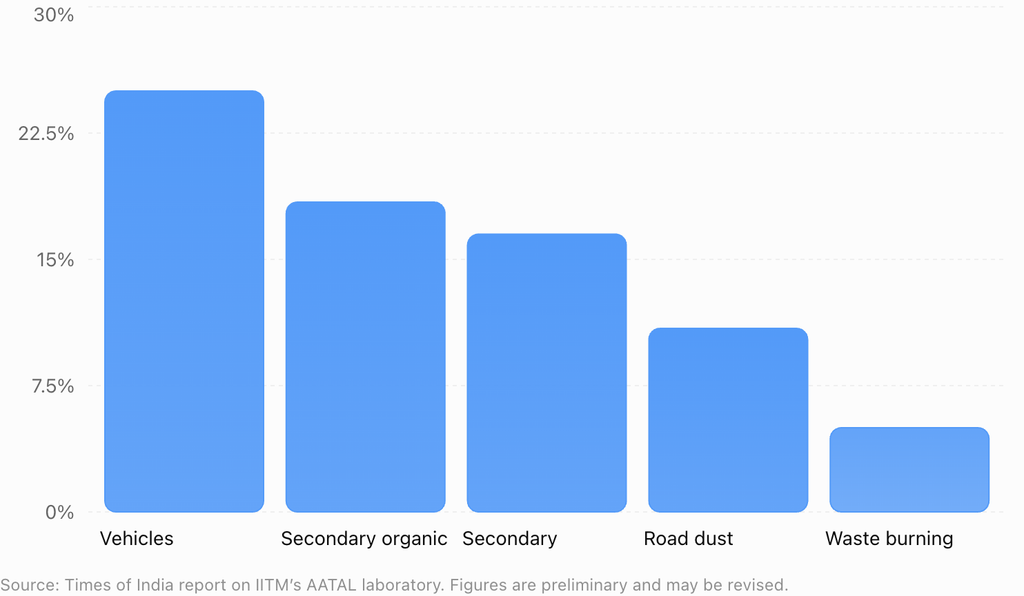
Early figures reported from the laboratory offer a snapshot of how several sources may contribute to Delhi’s PM2.5. In one reported daily estimate, vehicles accounted for 25% of the measured source contribution, followed by secondary organic aerosols and secondary inorganic aerosols.
One preliminary daily estimate reported in October 2026. These are not annual averages or a definitive ranking for every season.
One preliminary daily estimate reported in October 2026. These are not annual averages or a definitive ranking for every season.
0%7.5%15%22.5%30%VehiclesSecondary organic aerosolsSecondary inorganic aerosolsRoad dustWaste burning
Source: Times of India report on IITM’s AATAL laboratory. Figures are preliminary and may be revised.
The listed categories add up to 75.8%. The remaining share is not represented in this chart, so the figures should not be treated as a complete breakdown.
The figures suggest that vehicle emissions are only one part of the problem. Particles that form through atmospheric chemistry can account for a substantial share of the measured pollution, while dust and waste burning also appear in the initial estimates.
However, the data require careful interpretation. These were early, experimental estimates rather than a settled picture of Delhi’s pollution across an entire year. A subsequent Hindustan Times report highlighted discrepancies between the laboratory’s reported PM2.5 totals and readings from Delhi’s monitoring stations, as well as changes to some displayed source estimates. Officials reportedly said the new system was still being calibrated.
For that reason, the figures are best understood as an early indication of what the new laboratory is trying to measure, not conclusive evidence that a particular source contributes a fixed percentage of Delhi’s pollution. Further validation and consistent, transparent reporting will be important before drawing firm conclusions.
The term secondary particulate matter can sound technical, but the idea is straightforward. Some pollutants are emitted as gases and then react with other substances in the atmosphere, forming particles that add to PM2.5.
For example, nitrogen oxides from combustion, sulphur dioxide from certain industrial and fuel-burning activities, and ammonia can participate in chemical processes that produce secondary inorganic particles. Volatile organic compounds can contribute to secondary organic aerosols.
This means that a pollution-control strategy focused only on visible smoke, exhaust pipes or dust may miss part of the problem. Reducing the gases that form particles later can also be important, even when the resulting particles are not directly emitted at the source.
It also complicates responsibility. A particle measured in Delhi may have formed after gases from several activities mixed in the atmosphere, and some of its precursors may have travelled from outside the city. Identifying the source of the final particle is therefore not always the same as identifying the original activity that produced its ingredients.
Research on Delhi’s air has repeatedly shown that the balance can vary by season and by the pollutants being studied. A finding from a winter haze episode should not automatically be applied to summer dust pollution or to the whole NCR.
Delhi-NCR has not been without pollution research. Earlier studies established a baseline, but their findings cannot be compared as if every project used the same methods, locations and time periods.
A TERI-ARAI assessment based on monitoring at 20 representative locations across Delhi and parts of Haryana and Uttar Pradesh examined PM2.5 and PM10 during two seasons in 2016–17. It used both chemical analysis of collected particles and dispersion modelling to estimate source contributions. The researchers reported that Delhi’s own emissions accounted for an average of 36% of PM2.5 concentrations in the city during winter and 26% during summer, with variation across locations.
Those figures are important, but they answer a different question from the new daily laboratory estimates. They refer to the contribution of Delhi’s own emissions to concentrations measured in the city, not the same category-by-category daily split reported by AATAL. The studies also differ in their methods, monitoring periods and geographical coverage.
The broader lesson is that pollution shares depend on what is measured, where it is measured and when. A source may account for a larger share during one season or at one location and a smaller share elsewhere. A new inventory can improve the evidence base, but it must be compared carefully with older work.
A February 2026 expert report considered by CAQM reviewed source-apportionment studies conducted between 2015 and 2025. Its pooled analysis identified different leading contributors to PM2.5 in winter and summer, reinforcing the need for seasonal strategies rather than a single explanation for Delhi’s air pollution.
Percentages from the CAQM-reviewed expert meta-analysis of studies from 2015–2025.
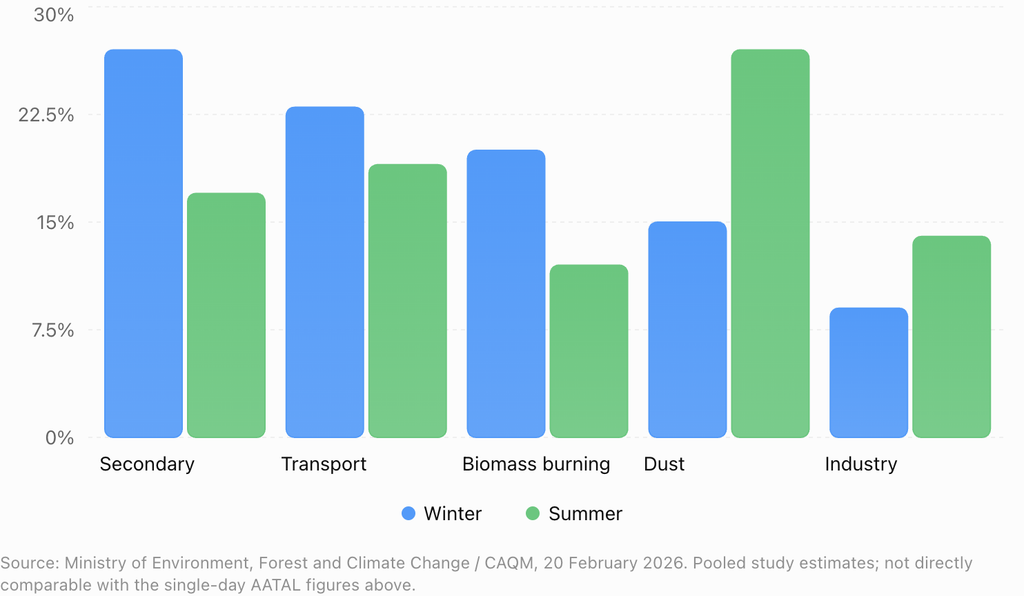
Source: Ministry of Environment, Forest and Climate Change / CAQM, 20 February 2026. Pooled study estimates; not directly comparable with the single-day AATAL figures above.
The seasonal contrast is clear. In the reviewed studies, secondary particulates, transport and biomass burning featured prominently in winter, while dust was the largest listed contributor in summer. Transport and industrial sources remained relevant in both seasons.
These numbers are not a direct forecast for every day in Delhi. They summarise a range of studies with different conditions and methods. They should also not be compared directly with the AATAL chart, which shows a preliminary daily estimate from a new laboratory.
Even so, the findings support a practical conclusion: Delhi-NCR needs several pollution-control measures working together. Vehicle emissions, industrial pollution, dust, open burning and the gases that form secondary particles all require attention, with the emphasis adjusted to seasonal conditions and local evidence.
For people living in Delhi, Noida, Gurugram, Ghaziabad, Faridabad and other NCR cities, the source of pollution matters because it can guide public policy. But residents do not need to identify the precise chemical mix before taking sensible precautions during a pollution episode.
Check the CPCB AQI for your location, rather than relying only on a region-wide headline. Pollution can vary between neighbourhoods, and a city average may not reflect the conditions near a busy road, construction site or industrial area. CPCB’s national AQI framework classifies readings from Good through Satisfactory, Moderate, Poor, Very Poor and Severe.
When air quality is poor, consider reducing strenuous outdoor activity, particularly near heavy traffic or visible sources of pollution. People with asthma or other heart and lung conditions, older adults and children may need to be especially careful and follow advice from their healthcare professionals. Indoor air can also be affected by outdoor pollution, so keeping windows closed during severe episodes may help when outdoor air is worse, provided indoor ventilation and heat conditions are considered.
These steps can reduce exposure, but they do not replace emission controls. Longer-term improvements depend on coordinated action across transport, industry, construction and road-dust management, waste burning, agricultural burning and regional pollution movement.
The upcoming inventory and the new laboratory could help authorities determine which interventions are working and where gaps remain. Their value will depend on the quality, consistency and public availability of the data, followed by action based on the findings.
The key milestone is the publication of the new emissions inventory and its analysis. Until then, headlines about a changed or more toxic pollution mix should be treated cautiously.
The strongest evidence will come from a transparent comparison with previous assessments, with clear explanations of the baseline years, pollutants measured, seasonal coverage, geographical boundaries and uncertainty in the estimates. Consistent source monitoring will also help show whether changes reflect a real shift in emissions or differences in the way the studies measure pollution.
For Delhi-NCR, the goal is not simply to know which source ranks first on a particular day. It is to understand what is polluting the air, where the pollution originates, how it changes in the atmosphere and which interventions can reduce people’s exposure over time.
A new emissions inventory is being developed to investigate this question. Until its findings are published and compared with earlier studies, it is not possible to confirm the extent of any change.
There is no single source that dominates in every season and location. The CAQM-reviewed expert analysis identified secondary particulates, transport and biomass burning among the major winter contributors, while dust was the largest listed contributor in summer.
Secondary aerosols are tiny particles formed in the atmosphere when gases react chemically. Secondary organic aerosols can form from volatile organic compounds, while secondary inorganic aerosols include particles produced through reactions involving gases such as sulphur dioxide, nitrogen oxides and ammonia.
No. The initial source estimates were experimental and preliminary. Reporting has also raised questions about differences between some laboratory readings and wider monitoring-station data. The figures should not be treated as definitive annual pollution shares.
Weather, wind, humidity, atmospheric chemistry and seasonal activities influence both emissions and how pollutants accumulate. Dust can be more prominent in summer, while winter conditions can favour the build-up of fine particles and secondary pollution.
Residents can check the Central Pollution Control Board’s National AQI portal for air-quality information. Local readings are more useful for exposure decisions than relying on a single NCR-wide figure.
Part of the NCR Guide editorial team, covering news, real estate, food and lifestyle across Delhi NCR.
Join thousands of Delhi NCR residents who start their day with our morning brief — top stories, real estate updates, events and deals.